
Just enter your policies & rules in Network Compliance and off you go! Check my blog: All you need to know about Compliance Policies.
Let's say you've run your first compliance checks on your policies. Now you want to check how you did. This article will detail the ways in which you can see the results. I will show you how to get an overview, both for a small set of nodes and a big collection of nodes with a complex set of policies and rules applied on them.
Dashboard for a birds eye view
There are two pages we are interested in, both can be found in the Compliance section in the Operate menu: the Dashboard and the Reports. We'll start with the dashboard, which is designed to give you a bird's eye overview of all of your policies:
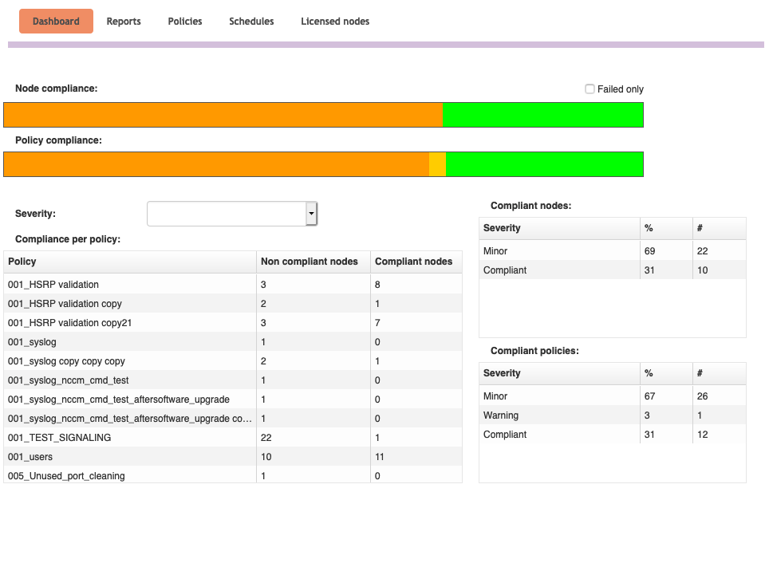
The two coloured bars indicate how many of your policies are compliant, and how many of your nodes are compliant. If they are not, this is indicated by their severity color. This gives you a very basic overview of the results of your compliance checks. If there's a lot of red, you know a lot of critical policies are failing, and action needs to be taken. These colours by can be customized through the NCCM Lookup form, in the NCCM menu. Our experience is that in most production environments most policies will be compliant, so you can also check the option to show the failed only, so you can zoom in on the details that matter: the non-compliant ones.
The grids at the right give you a text overview of these bars. The left grid gives you a very quick overview of all of your policies, and the amount of compliant and non-compliant nodes. Note that the numbers here correspond to all the nodes that the compliance knows about, so nodes it can't find the configuration for or ones that are still being evaluated won't show up in these numbers.
Reports for detailed information
Now that we've got the basic gist of our results, it's time to check them in detail in the Reports tab. There are lots of different ways you can filter, and since it can be cumbersome to keep inserting the same filters over and over again, we support Report templates, where you can save your queries for future use by either you or your colleagues.
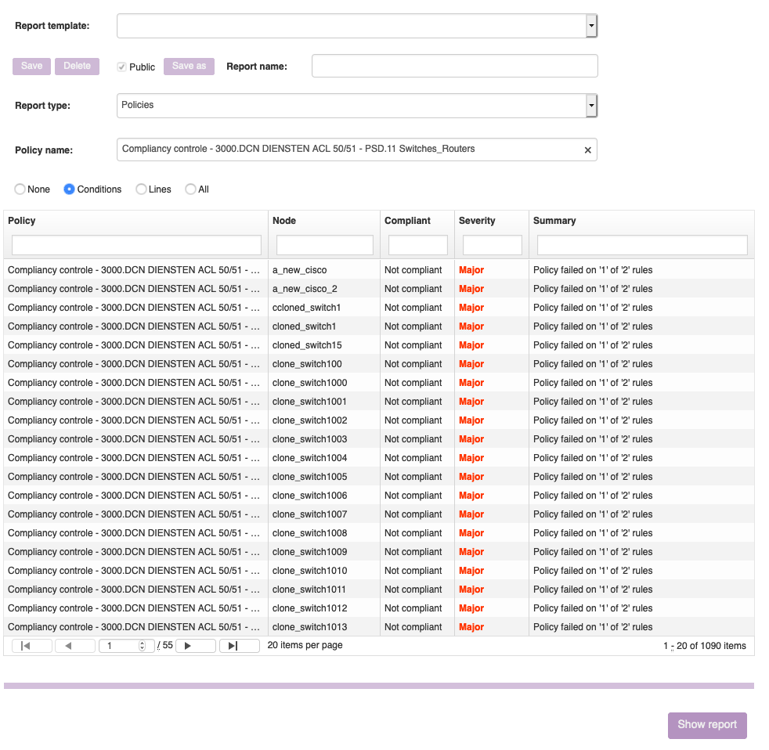 The Report type determines what kind of report you'll see. You can show your results by policy or by nodes, so you can see every policy that is run on a node. You can show the results per policy, or you can also show them per rule, depending on how fine-grained you want your results. Important: you need to input a policy in the input field if you select a policy report type and a node group name if you want to filter by nodes. Once you have, a preview appears of all of the records that will match for this report.
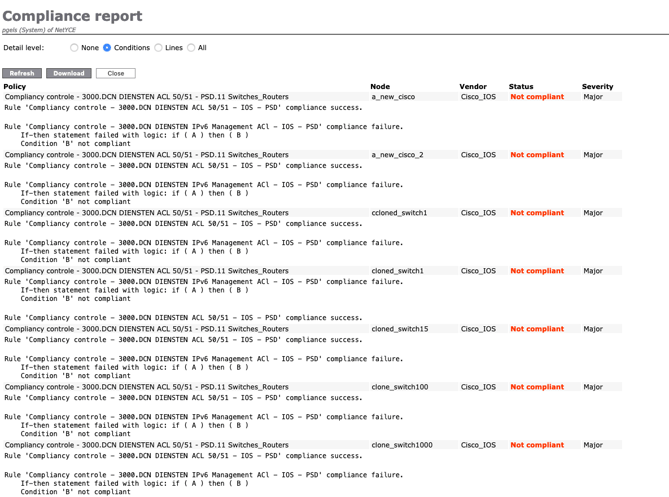
In the Report you see a number of nodes that are not compliant. To see exactly why, click on "Show report". This will show the Compliance Report (see below), an overview of the compliance results, and for every non-compliant rule or policy an explanation. Reports can get huge, or small, and the detail level option allows you to specify how much information you want to see. If you want, you can export a csv-file with the report details and view it in your favourite spreadsheet editor (with the detail level incorporated).
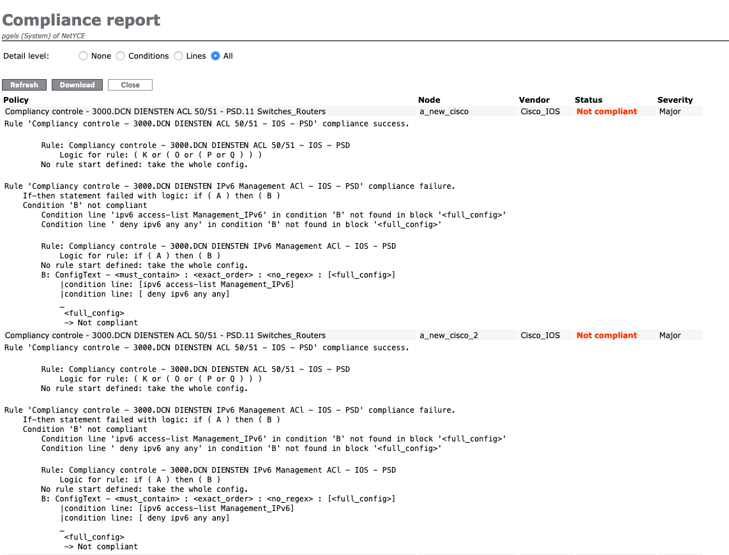
For an in-depth explanation of why your policy is not compliant, you can check the 'All' detail level. The details are broken down per rule, and they show the logic that applies to this rule. In the screenshot below, you can see various simple types of logic: an if-statement (so if one condition is true, then another needs to be true as well), and multiple nested or-statements (meaning that a minimum of one of the conditions needs to be true). When one of the conditions is not compliant, an explanation follows. If your rule is configured to the whole config, you'll see the <full_config>-tag, however if you have defined it on a specific block this will also show the exact block it is comparing against, allowing you to check what went wrong.
 With these tools, you are able to get your reports on either very large or very small datasets and depending on the level of detail you want to be able to show. You can also configure your policies to automatically send a message when not compliant (in four ways: syslog, trap, email and an api call), but that is a subject for a different blog article.
Want to know more?
Our #1 priority is helping you in your automation journey. If you want to know how we tackle network automation challenges, watch the video about our Full Stack Network Automation Platform here.
